To find cold spots with just a thermometer and a notebook, start by planning your measurement points around your home, focusing on areas like walls, corners, and entry points. Take consistent temperature readings at each spot, noting the location, time, and conditions. Record your data systematically, then organize it into a grid. If you continue with this process, you’ll learn how to interpret your results and make targeted improvements to boost comfort and save energy.
Key Takeaways
- Select strategic measurement spots around your home, including corners, high-traffic areas, and suspected cold spots.
- Use a reliable digital thermometer to record temperature readings at each location consistently.
- Log data systematically in a notebook, noting the location, time, and environmental conditions for each measurement.
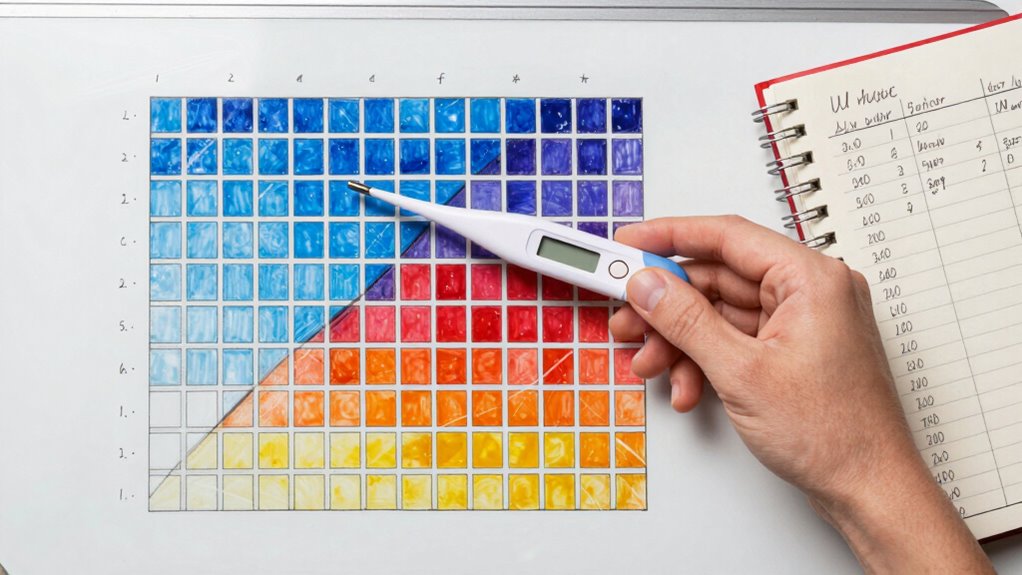
- Create a grid-based map, interpolating between data points to visualize temperature variations visually.
- Identify cold spots from the map to target insulation improvements and seal air leaks effectively.
Why Use a DIY Heat Map to Find Cold Spots

A DIY heat map helps you quickly identify cold spots in your space, saving time and money compared to more complex methods. By mapping thermal variability, you can spot areas where temperatures fluctuate unexpectedly. These cold spots often indicate insulation gaps that let heat escape or cold air seep in, impacting comfort and energy efficiency. Using a simple thermometer and a notebook, you can track temperature differences across different zones. This approach allows you to pinpoint problem areas without expensive equipment or professional evaluations. Addressing insulation gaps based on your heat map results helps improve insulation and reduce heating costs. Additionally, understanding thermal variability enables you to make targeted improvements that enhance overall home comfort. Recognizing insulation deficiencies through this method empowers you to prioritize specific upgrades for better energy savings. Conducting a DIY heat map also promotes a better understanding of your home’s thermal performance, allowing for more informed decision-making. Gaining insight into your home’s thermal behavior can help you identify problem areas before they become costly issues. Overall, creating a DIY heat map is an accessible, effective way to understand your space’s thermal issues and optimize your home’s comfort. This simple technique can even reveal hidden draft sources that contribute to cold spots and discomfort.
What Tools Do You Need for Temperature Mapping
To create an effective temperature map, you’ll need essential measurement tools like thermometers or thermal sensors. Don’t forget data recording supplies such as notebooks or digital devices to track your readings accurately. Optional data aids, like software or remote sensors, can help improve your mapping process and results. Utilizing precise temperature measurement techniques ensures more accurate and reliable heat maps. Additionally, understanding European cloud innovation can help you select tools that are compatible with sustainable and secure solutions. Being aware of emerging cloud technologies can further enhance data collection and analysis for your temperature mapping efforts.
Essential Measurement Tools
Essential measurement tools are the foundation of accurate temperature mapping. Your primary tool is a reliable thermometer, ideally a digital one for quick readings. To guarantee accuracy, you must regularly perform sensor calibration, which corrects measurement errors and maintains precision. A simple calibration process involves comparing your thermometer’s readings against a trusted reference. Accurate data analysis depends on consistent measurements, so recording conditions and calibration status is vital. While a notebook is indispensable for jotting down measurements, consider a portable device with data logging capabilities for easier analysis later. Remember, precise measurements are key to identifying cold spots, so investing in quality tools and maintaining them through proper calibration can make your DIY heat map considerably more reliable. Additionally, understanding the measurement accuracy of your thermometer helps ensure your temperature data is trustworthy. Incorporating proper documentation practices can further enhance the reliability of your mapping efforts, ensuring you have comprehensive records to analyze over time. Regularly verifying the sensor calibration can prevent drift and ensure ongoing precision in your data collection. Moreover, selecting tools with high precision can significantly improve the overall quality of your temperature mapping. Recognizing the importance of system vulnerabilities can help you develop contingency measures to protect your data collection process.
Data Recording Supplies
Accurate temperature mapping relies on having the right tools to record your data consistently. You’ll need a reliable digital thermometer to take precise measurements, ensuring your readings are accurate throughout your mapping process. Select a thermometer with a clear display and quick response time for efficiency. Alongside this, a sturdy data notebook is essential for logging each temperature reading systematically. Use it to note the location, time, and any relevant environmental conditions. Consistent recording helps identify patterns and cold spots more effectively. Keep your data notebook organized, with clear labels and space for additional notes. Additionally, choosing a thermometer that maintains calibration ensures your data remains reliable over multiple uses. Regular calibration checks are an important part of maintaining measurement accuracy over time. To further ensure data precision, consider using calibration tools to verify your thermometer’s accuracy periodically. Regularly updating your calibration procedures can help prevent drift and maintain measurement reliability. Together, digital thermometers and data notebooks form the foundation of accurate, repeatable temperature mapping, simplifying the process and ensuring your findings are reliable. Maintaining vetted tools ensures the integrity of your data collection.
Optional Data Aids
Wondering what extra tools can make your temperature mapping more effective? Consider using simple aids to better understand insulation gaps and airflow patterns. These tools help identify hidden cold spots and improve accuracy:
- A small flashlight to spot insulation gaps or drafts behind walls and corners.
- A mirror on a stick to see behind furniture or tight spaces.
- A handheld anemometer to measure airflow, revealing drafty areas.
- Thermal imaging apps or infrared thermometers to visualize temperature differences quickly.
- Air circulation tools like small fans or smoke pencils can help visualize airflow patterns and identify areas where drafts might be entering. Using thermal awareness techniques and tools can further enhance your ability to detect subtle temperature differences and airflow issues. Being familiar with thermal dynamics can help you interpret your temperature data more effectively. Additionally, understanding heat transfer principles can guide you in making targeted improvements to your home’s insulation and ventilation. These aids can highlight areas where insulation might be lacking or airflow patterns create cold spots. Using them alongside your thermometer and notebook makes your DIY heat map more precise, helping you target problem zones effectively. Developing a sense of thermal comfort can also assist in recognizing areas that need attention beyond just measurable temperature differences.
How to Measure and Record Temperatures Systematically
You need to select the right spots to measure temperatures, ensuring you cover key areas for accurate mapping. Consistently recording data at each location helps you track changes over time. By sticking to a systematic approach, your heat map will be reliable and easy to analyze. Incorporating an understanding of essential oils for temperature-related discomforts can also enhance your assessment process. Additionally, being aware of ventilation considerations can improve the overall effectiveness of your temperature monitoring system.
Choose Measurement Locations
Selecting the right measurement locations is essential for creating an effective heat map, as it determines how well you capture temperature variations across the area. Focus on strategic sensor placement to cover high-traffic zones, corners, or suspected cold spots. Consider the measurement frequency; more frequent readings provide detailed insights. Picture these steps:
- Place your thermometer at key points like doorways or vents.
- Aim for diverse heights and orientations to reflect real conditions.
- Avoid obstructions that could skew sensor readings.
- Mark each spot clearly for consistent measurement during each session.
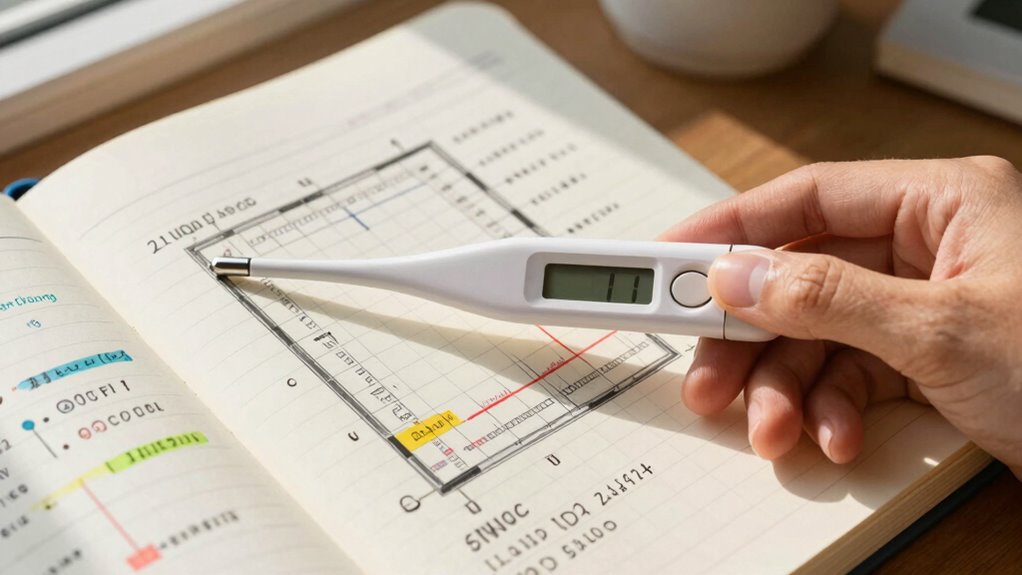
Record Data Consistently
To guarantee your heat map accurately reflects temperature variations, it’s essential to measure and record data systematically. Begin by calibrating your thermometer regularly to ensure sensor accuracy; uncalibrated sensors can lead to misleading data. Maintain a consistent measurement process—use the same time of day, similar environmental conditions, and consistent placement for each reading. Record each temperature carefully in your notebook, noting the location and time. This consistency is crucial for effective data analysis later on. Keep your measurements organized and avoid skipping points, as gaps can distort the heat map. By following a structured approach, your data will be reliable, making it easier to identify cold spots and understand temperature patterns across your space.
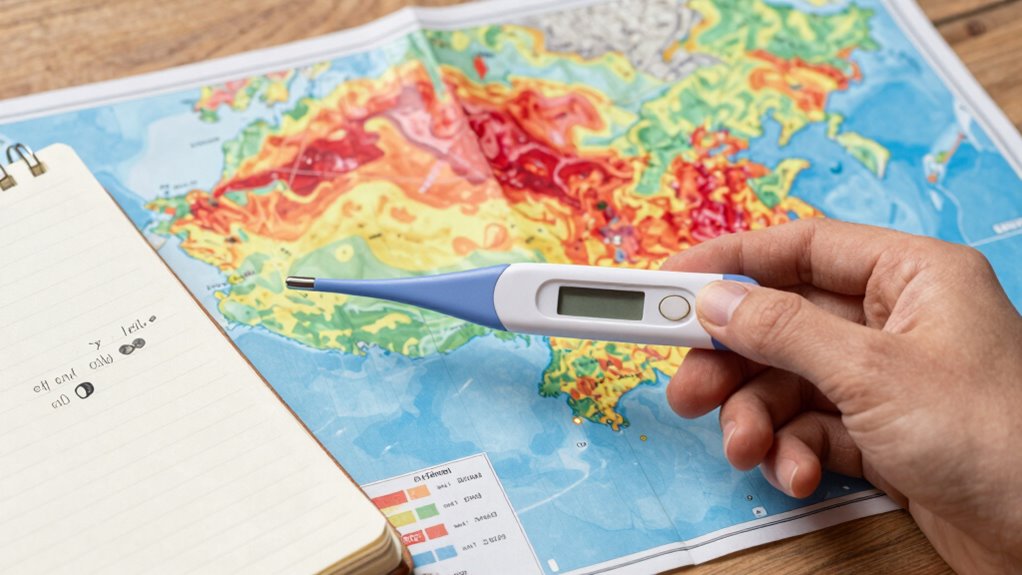
How Can You Turn Temperature Data Into a Visual Heat Map
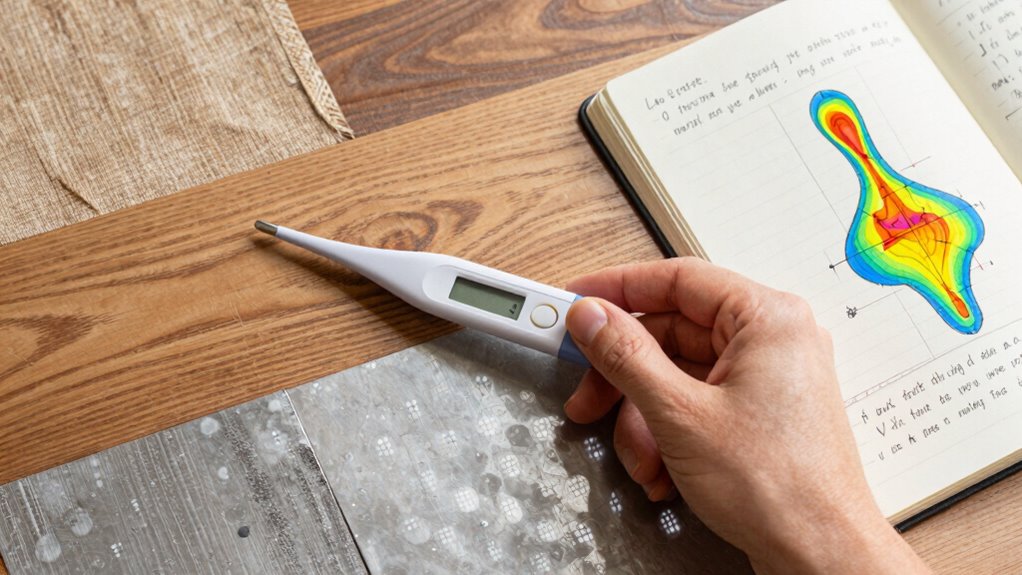
Transforming temperature data into a visual heat map involves several key steps. First, you gather your temperature readings across different spots, creating a grid of data points. Next, you use data interpolation to estimate temperatures between your measured locations, filling in gaps smoothly. Then, apply thermal imaging techniques—either digitally or manually—to assign colors to various temperature ranges, with cooler spots in blues and warmer areas in reds. Finally, compile your color-coded data onto a map, creating a visual representation of hot and cold zones. Visualizing your data this way makes cold spots obvious at a glance, helping you identify problem areas quickly. By combining careful data collection with interpolation and color mapping, you turn raw temperature readings into an intuitive, easy-to-understand heat map.
Troubleshooting Tips for Accurate Cold Spot Detection
Accurate cold spot detection depends on proper calibration and consistent data collection. If your thermometer isn’t calibrated, readings can mislead you, making it harder to identify problem areas. Ensure your thermal insulation is intact, as gaps can cause false cold spots. When troubleshooting HVAC issues, look for uneven airflow or drafts that skew temperature readings. Use the following table to assess your setup:
| Symptom | Possible Cause | Solution |
|---|---|---|
| Inconsistent readings | Poor calibration | Recalibrate thermometer |
| Cold spots near windows | Thermal insulation gaps | Seal leaks and add insulation |
| Unexpected cold areas | HVAC airflow issues | Check vents and filters |
| Fluctuating temps | Drafts or leaks | Seal leaks, improve insulation |
| Noisy equipment | HVAC troubleshooting problems | Schedule professional inspection |
How to Use Your Heat Map Results to Improve Comfort and Save Energy

Once you have your heat map results, you can identify specific areas where your home cools down more than it should or where drafts and insulation gaps exist. To improve comfort and energy savings, focus on enhancing thermal insulation in these spots. Consider these steps:
Use heat map data to target drafts and improve insulation for a more comfortable, energy-efficient home.
- Seal leaks around windows and doors to block drafts.
- Add insulation to walls, attics, or crawl spaces where cold spots appear.
- Use weatherstripping or door sweeps to prevent heat loss.
- Upgrade old or inefficient windows for better thermal performance.
Frequently Asked Questions
How Often Should I Update My Temperature Measurements?
You should update your temperature measurements daily or weekly, depending on your project’s needs. Regularly calibrate your sensor to guarantee accuracy and maintain consistent data logging frequency to capture reliable data. If you’re tracking rapid temperature changes, log more frequently. For stable conditions, less frequent updates suffice. Stay consistent with calibration and logging to identify cold spots effectively and maintain the accuracy of your DIY heat map over time.
Can This Method Detect Hidden or Insulated Cold Spots?
Yes, your method can detect hidden or insulated cold zones, but it might be less effective for deeply insulated areas. Insulation effects can mask temperature differences, making cold spots harder to spot with just one thermometer and careful notes. To improve detection, move the thermometer around more often, especially in areas where insulation might hide cold zones. Regularly updating your measurements helps reveal these concealed cold spots.
What Is the Ideal Number of Measurement Points for Accuracy?
For accurate results, you should take at least 20-30 measurement points. More points improve data resolution, giving you a clearer picture of temperature variations. This guarantees better measurement accuracy by capturing subtle cold spots and temperature differences. Spread your measurements evenly across the area, especially in suspected cold or insulated zones. Higher data resolution helps you identify hidden cold spots more precisely, making your DIY heat map more reliable.
How Do External Weather Conditions Affect Readings?
Like a ship lost in fog, external weather conditions can greatly influence your readings. Weather influence causes temperature fluctuation, making outdoor measurements less consistent. Wind, sunlight, and rain can all skew your thermometer’s accuracy, especially if you don’t shield it properly. To minimize these effects, measure during consistent weather or indoors, and record conditions to better interpret your data. This way, your cold spot detection stays reliable despite the weather’s chaos.
Can I Use This Technique Indoors and Outdoors Equally Well?
Yes, you can use this technique both indoors and outdoors, but keep in mind that indoor climate differs from outdoor environment. Indoors, temperature variations are usually less extreme, so readings might be more stable. Outdoors, weather conditions like wind, sun, or rain can influence your measurements. Adjust your approach accordingly, taking multiple readings to get an accurate picture of temperature differences in either setting.
Conclusion
With your DIY heat map, you’re fundamentally shining a flashlight into the shadows of your home’s comfort. By pinpointing those chilly corners, you’re turning the cold, silent whispers of poor insulation into a clear story of change. Think of it as your personal treasure map—guiding you to warmer, more energy-efficient days ahead. Embrace this tool, and watch your home transform from a frosty mystery into a cozy sanctuary, one spot at a time.